This post is a quick summary of the things I’ve done to get my iSpindles built and configured along with a few tips for things I’ve stumbled on. It certainly isn’t a step-by-step explanation of how to do everything.
The Build
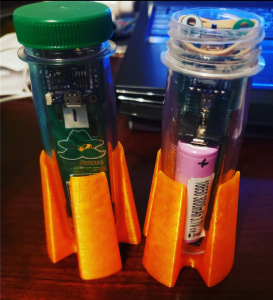
I ordered parts through ebay to make things more simple. This seller was awesome and the kit is excellent
iSpindel (Tilt) Parts Kit + Stand Wireless Digital Hydrometer/Thermometer
This kit includes:
- iSpindel Stand (color varies)
- PCB (Jeffrey 2.69 designed by Open Source Distilling)
- Wemos D1 Mini v3 (flashed with firmware for verification)
- MPU-6050 IMU (sensitivity and range verified)
- TP4056 USB-C Charging/Protection Board
- DS18B20 Temperature Sensor
- 18650 3.7V Lithium Cell
- Battery Holder
- Miniature Switch
- BAT43 Diode
- 4.7K Resistor
- 220K Resistor
- PET Preform Tube
- 5x #10 Hex Nuts + Small roll of Gorilla Tape (for calibration)
The Open Source Distilling build video was spot on. Would be nice if he paused for a moment a few times, but nothing a rewind and pause couldn’t solve.
Build the ispindle with this video: https://www.youtube.com/watch?v=z0Gwi09C-Yk
Once build you can use ESP8266Flasher.exe to flash firmware (https://github.com/universam1/iSpindel/releases) , but I found that my D1 Mini’s were already flashed by the Ebay seller.
I have been wanting to configure the iSpindle to send to my influxdb, but was having issues with firmware v2.5.1 integration. Then I found an alternate firmware to use called GravityMon. Gravity Mon seems to have a much pretty interface, calibration mode, and the ability to send data to multiple destinations. In my case I knew I could use Ubidots as I figured out my influxdb/grafana configurations.
l flashed gravitymon binary (https://github.com/mp-se/gravitymon) with the ispindle firmware update option. When I flashed the first iSpindle it took a while (~1 min) for the iSpindle to come online after the flash but it worked. The second iSpindle seem to flash right away.
Follow the configuration instructions on the Documentation section. While it is in the documentation, don’t foget that to enter calibration mode after the accellerometer has been configured that the iSpindle needs to be flat when is it turned on or reset.
mDNS
GravityMon broadcasts in mDNS and it seemed nice to use this rather than my set IP addresses (I’ve set a fixed IP address to each devices MAC address). My Win7 machine doesn’t support this natively and I installed: Download Bonjour Print Services for Windows v2.0.2 (https://support.apple.com/kb/dl999?locale=en_US), but at the moment this isn’t working for some reason and I’ll have to get back to it
Ubitdots Configuration
I have previously setup Ubidots with two devices that had broken. So I set out to configure the new devices to push into those instances. To configure the iSpindle for Ubidots see the Service Integration section. I placed the the ubitdots call into the Push Section of the Configuration page, HTTP 1 (Push) field using the option 2 from the Service integration documentation.
Header 1 (Header: value): http://industrial.api.ubidots.com/api/v1.6/devices/<devicename>Replace the device name in the <devicename>. I had titled my device in Ubidots as ispindle001
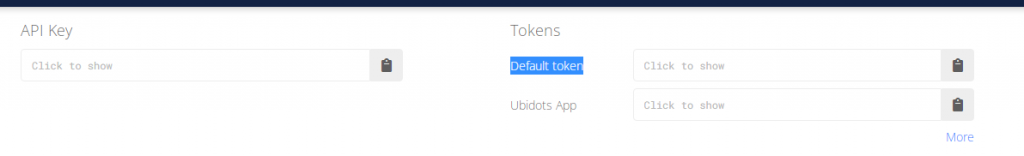
Then click on the Header button to configuration the Ubidots API token. Use the the default token or other token created (it is not the API Token) in Ubidots.
influxdb Configuration
I am pretty new to influxdb and this took me a bit to get the iSpindle configured correctly. However, GravityMon supports influxdb with no issues once you actually do things write
go to push2 settings to enter the influxdb config
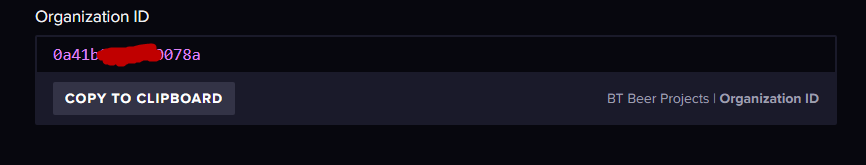
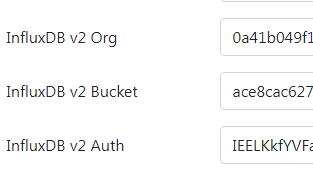
In the About section get the hex value of organization ID (not the Text name)
I made two tweaks to the influxdb format. First was to change “host” to “deviceName” as that is just easier for me to reccognize. Second, was to add an Event field which is populated with the value filled in the Token field on the Push 1 setting section. Now I can change the Token field to the brew day and quickly filter my flux queries to that one day.
measurement,deviceName=${mdns},deviceID=${id},event=${token},temp-format=${temp-unit},gravity-format=${gravity-unit} gravity=${gravity},corr-gravity=${corr-gravity},angle=${angle},temp=${temp},battery=${battery},rssi=${rssi}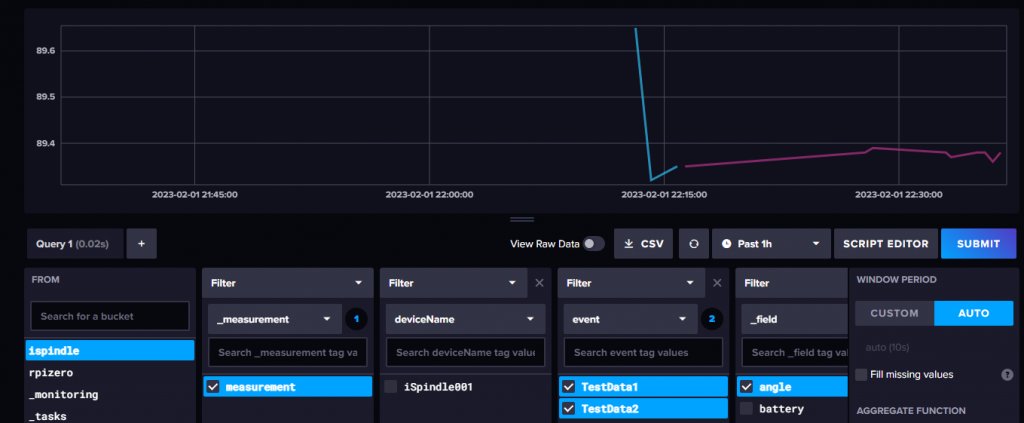
Grafana Cloud Configuration
Grafana is new to me as well, but this wasn’t too hard to setup. following the documentation (https://docs.influxdata.com/influxdb/cloud/tools/grafana/). Just like the iSpindle setup, use the used hex values rather than text names for org, bucket. Since I’m using Grafana Cloud with influxdb hosted at home I needed to add a port route into my router settings.
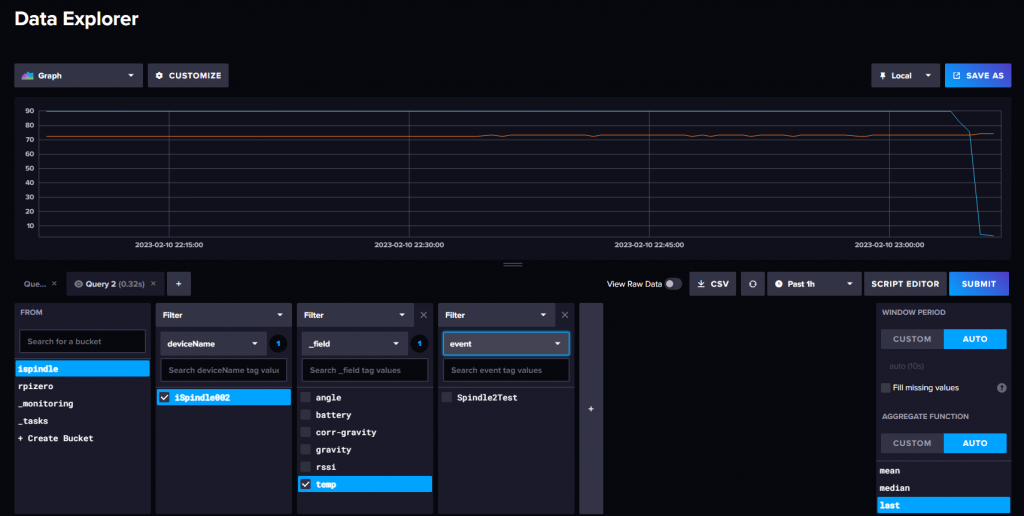
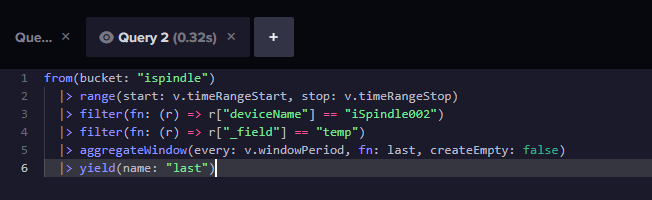
I am certainly a flux script editor novice, but I found I could create a sample query in influxdb and then copy the query into Grafana. To do this, create the query that you want. Then click the Script Editor button to get the flux query. Paste this into the Grafana Query. At this time I’ve proven I can create queries in Grafana, but I have more to do to get a good dashboard setup.
Tags: grafana, gravity mon, gravmon, influx, influxdb, ispindle, open source distilling, opensourcedistilling, ubidots
No comments
Comments feed for this article
Trackback link: https://bt.beerprojects.com/wordpress/wp-trackback.php?p=2327